Look at performance on a channel, artist, track or release level
To view individual performance, go the the reporting tab on the reports page: https://web.labelcaster.com/reports
Date range
Choose start and end months and click Apply to view royalty and unit data for your profile. The chart and table shows total royalty revenue (not splits).
Date type
The date type selects which date range is shown in both the chart and the table.
- Report date (default): the month that the royalties are reported and money is moved into accounts. Depending on the DSP, reporting is at least three months after the track's performance. [We suggest using Report Date for your reporting as it will match exactly the royalty data in our system.]
- Performance date: the month in which the event occurred that generated royalties—when the end user interacted with your music. These events, called “Units”, could be a play, stream, download, view, user creation, ad view, etc. This gives you a view that will match any play and streams data you have seen on DSP. [In the CSV file, this field is called “sales_end_date”]
Filters
Filters refine what data is shown in both the chart and table. For example, perhaps you want to see data only on a certain artist and their tracks, or you want to see how a particular Channel has performed.
Enter what you want to see data for in the appropriate filter. Selecting more filters further refines the selection (a logical AND). You can only have one value in each filter. The heading area under your entity name in the upper right will show what filter values you have chosen. Tap the Clear filters button to remove any filters.
You can filter by Channel (DSP), Track Artist, Release Title, Track Title, and UPC or ISRC.
Chart
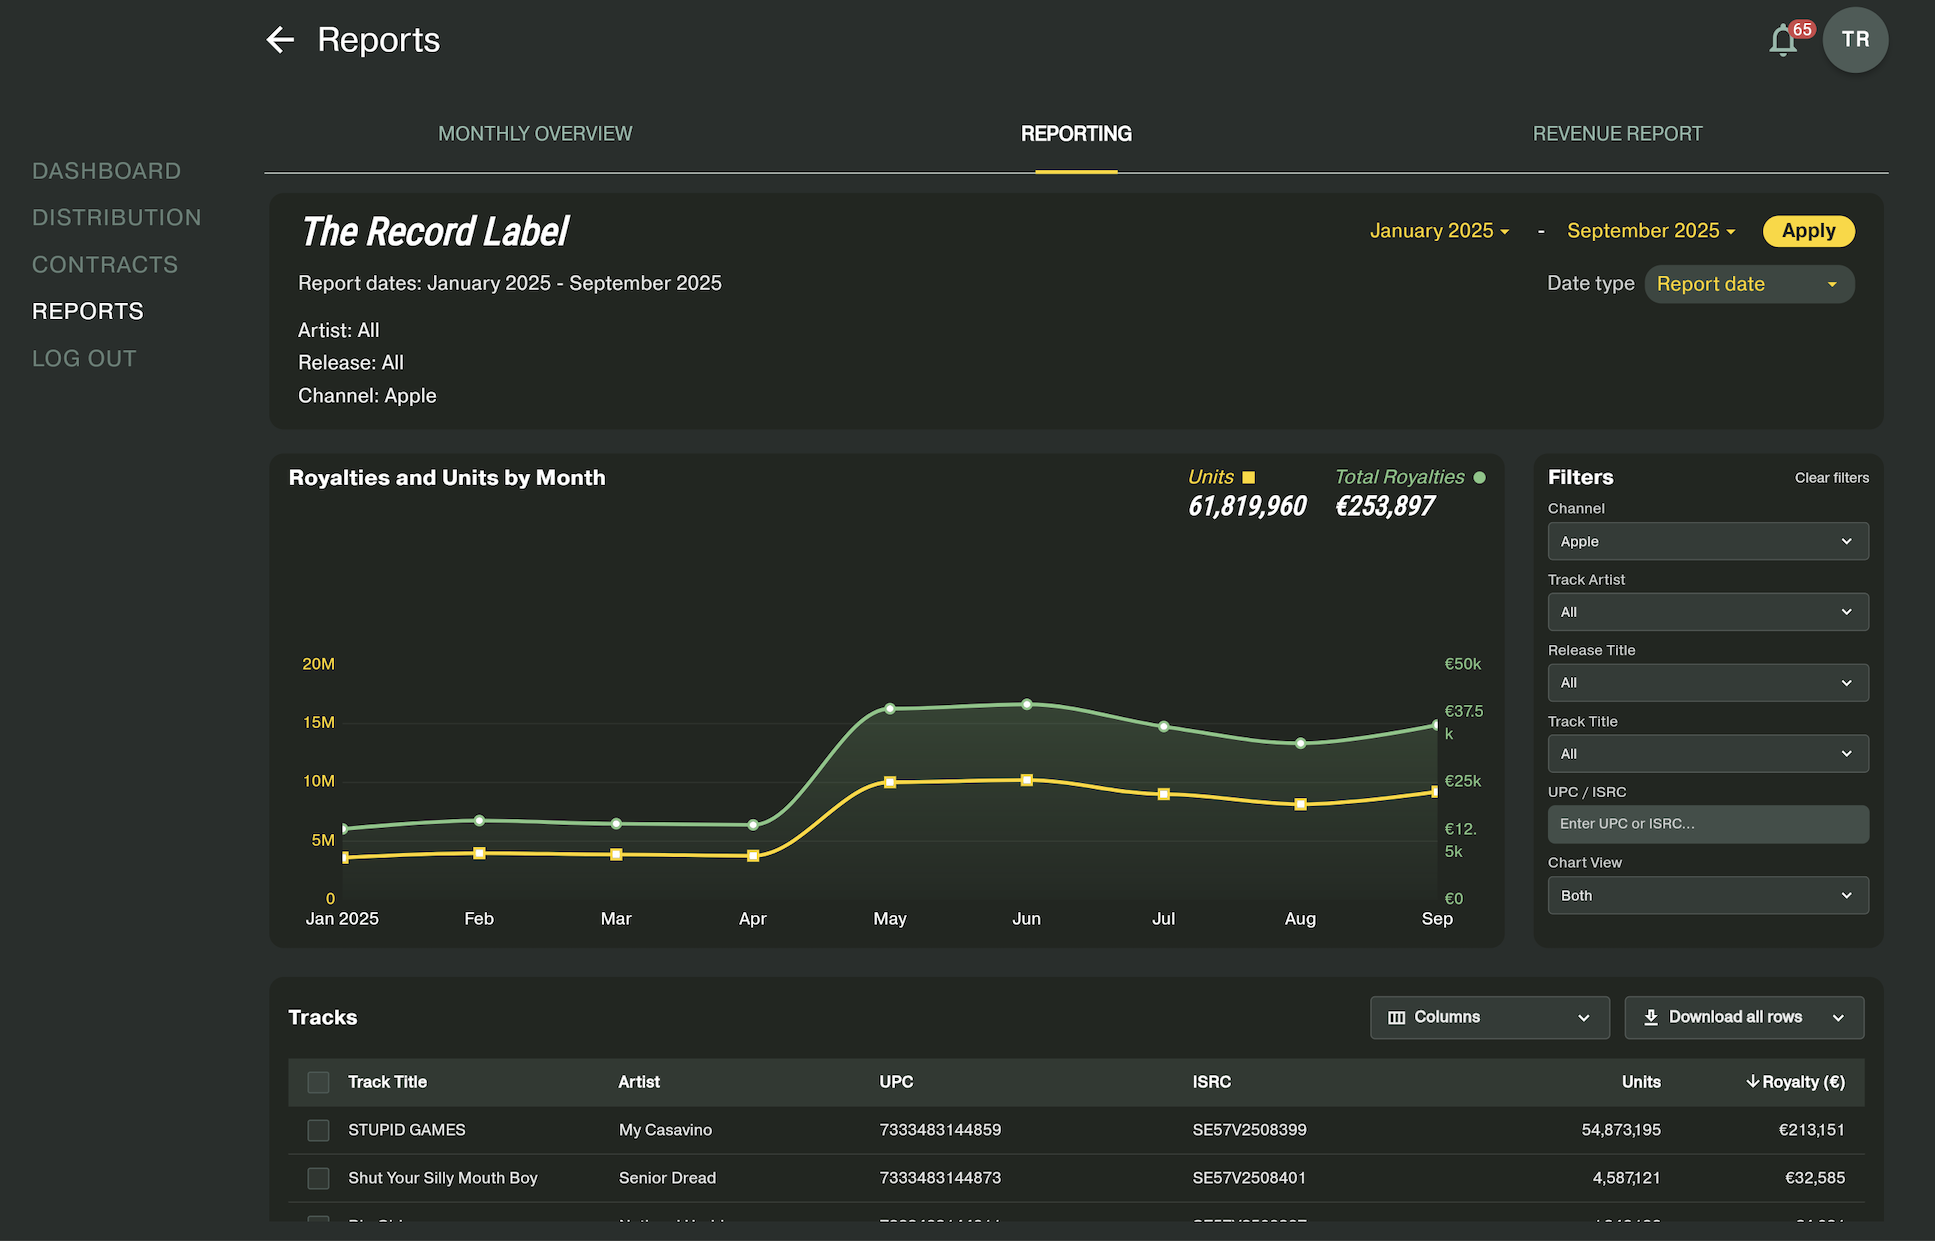
The Chart shows the Total Royalties for the filtered data within the date range.
The upper right section displays the total units and total royalties for the selected period, while the line chart shows them per month. You can hover over or tap a data point to get the specific month’s numerical totals.
The green line and left y-axis indicate total royalties in Euros
The yellow line and right y-axis indicate total units.
If you only want to see one type of data in the chart, e.g., royalties, select that from the Chart View drop-down menu.
Track table
The table shows details on the filtered data by track. Tap the column heading to sort by that type. Tap it again to reverse the sort.
You can view and hide columns from the Columns drop-down
Download the filtered data as a CSV or Excel file. Check individual boxes if you only want to download a subset of the data.