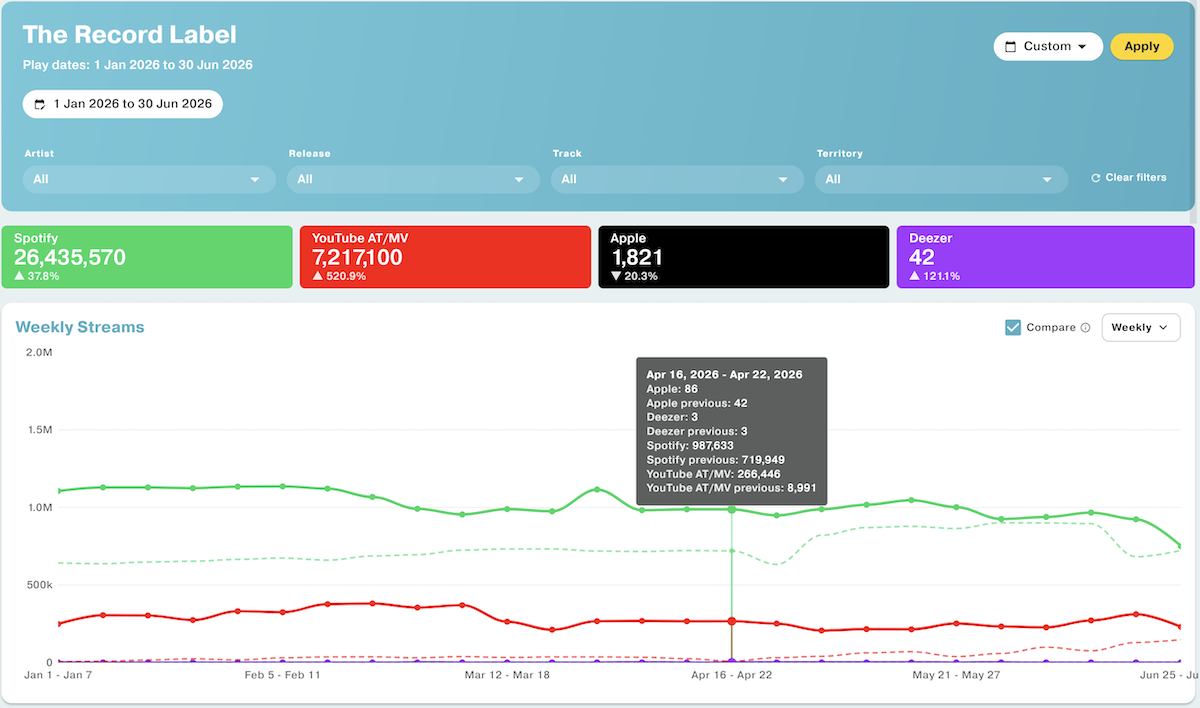
To give you feedback on artist, release and track performance, Labelcaster provides label accounts with streaming metrics from the major channels (DSPs). You can filter in several ways: see trends, view and compare channels, compare periods, zero in on a specific territory, and export the filtered data for your own use.
To get started, log in to your Labelcaster account and select the STREAMS tab. You immediately see all your releases’ stream plays for the last 30 days on Apple, Deezer, Spotify and YouTube Art Tracks / Music Videos. The colored boxes show total plays/views and a comparison percentage of what the tracks did in the previous time period.
Filtering the displayed data
There are several ways to filter the data. Filters affect all the charts, numbers and tables on the Streams page. Once you set filter values, click Apply to see the filtered data.
- Play Date range: you can choose a preset date range like This month or YTD (year to date), or select Custom to choose your own.
- Artist: all artists with active releases show up here
- Release: the top part of the menu lets you select only recently released material or select releases from a specific release date range. You can also select a specific release.
- Track: select a specific track to display just its streaming data. Like the Release filter, Tracks
- Territory and country: limit the view to specific regions and countries
- Click the colored channel boxes (labeled Apple, Deezer, Spotify, YouTube AT/MV) to toggle each DSP’s data.
These filters cascade, meaning that each filter limits the options of the following filters. For example, if you choose a specific release, only tracks from that release are available in the track filter; if you choose a specific artist, only their releases and tracks appear in the other filters.
- Click Clear filters to start over and remove all filter values.
Working with the chart
- Click the Compare checkbox in the chart to see how your tracks performed for the previous time period. You’ll see a dotted line on the chart for the previous time frame.
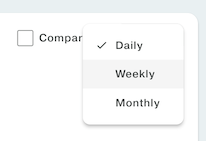
- The dropdown to the right of the chart adjusts the date granularity and aggregation to daily, weekly and monthly.
- Hover over a data point to see specific numbers for that date.
How to interpret the stream data
Streaming data comes in delayed by about 2-3 days from the play/view date. Use stream metrics only as an indicator of user interest, not as final royalty payment units for monthly reporting (see note below).
Streams shown are only for plays over 30 seconds; anything less than 30 seconds is not considered a legitimate play. Streams do not include any downloads, UGC, or advertising.
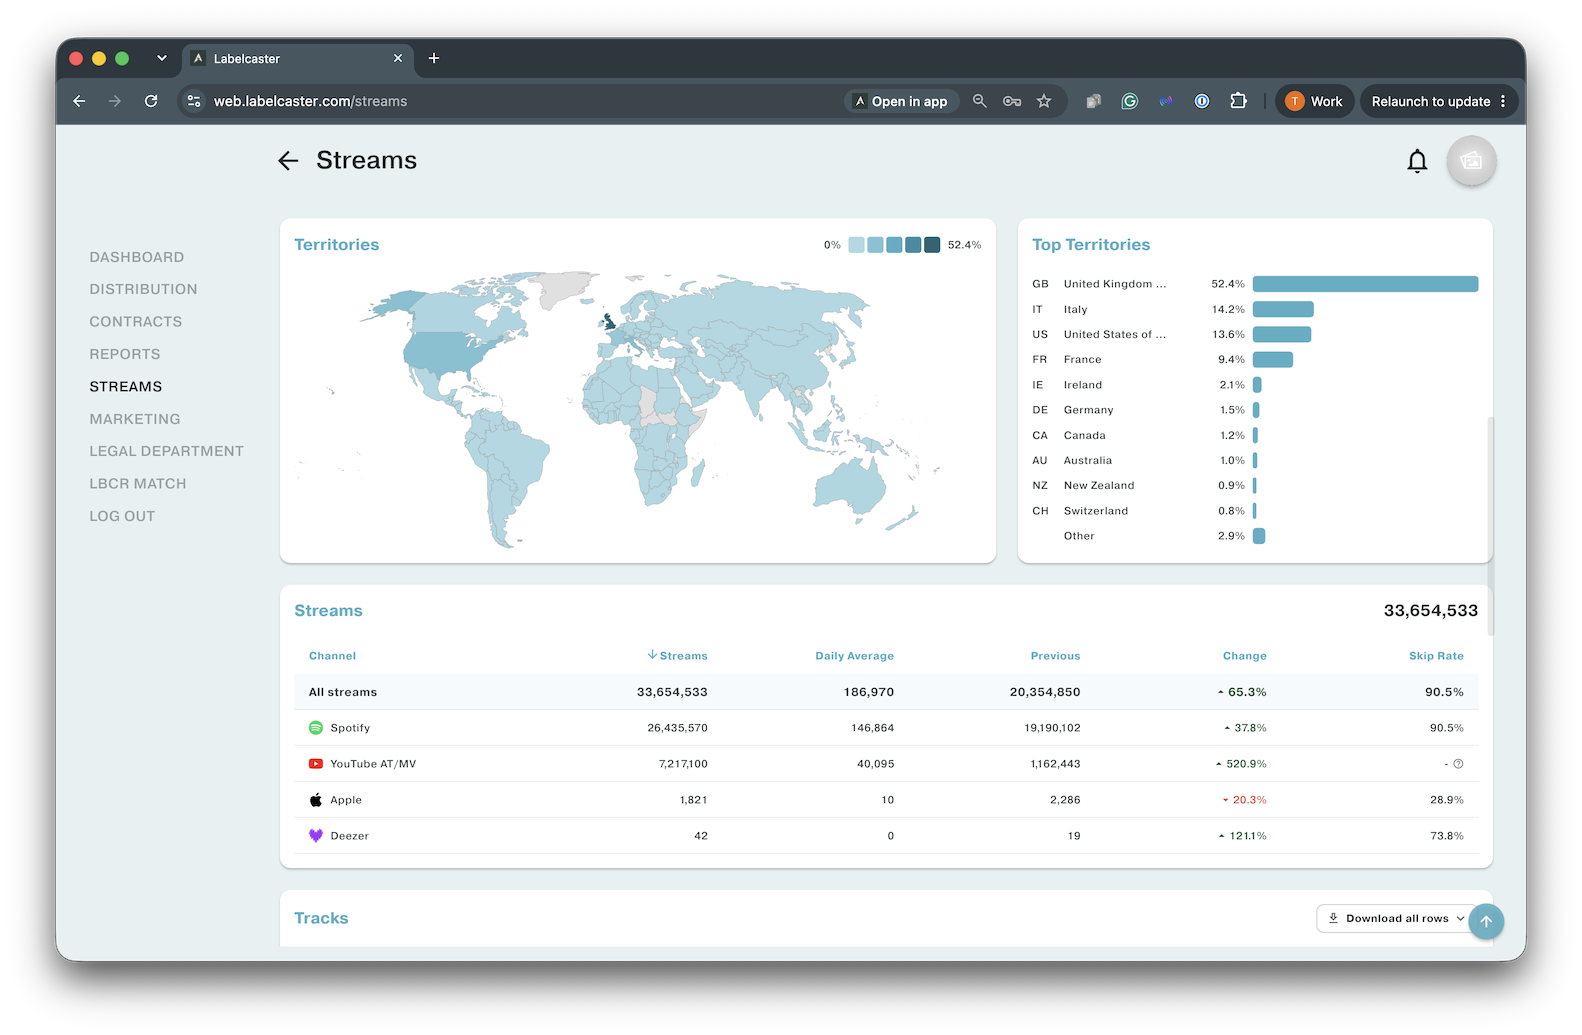
The Daily Average calculates the average number of streams over your selected date range and filtered data.
The Skip Rate shows the percentage of Streams that have been skipped (after 30 seconds). A high percentage can indicate artificial streams, as bots move on quickly after garnering a legitimate play.
For example, in your filtered data from the last 30 days, Spotify shows 10,000 streams with a skip rate of 28.2%. That indicates 10,000 plays that lasted more than 30 seconds each. Of those, 2,820 were skipped.
We support these services with this basic stream data:
 Apple: does not include downloads
 Deezer: all
 Spotify: all
 YouTube AT / MV (Art Tracks and Music Videos) only: does not show user-generated content plays